
Fewer Renters ≠ Less Vacancy Risk
A client told me they wanted to invest somewhere with a maximum of 5–10% renters. I nodded. Then I pulled up one chart. Nobody spoke for a bit.
Their logic was sound on the surface. Low renter proportion signals an owner-occupier dominated suburb – people who chose to be there, who maintain their properties, who attract others like them. Buy where people choose to own, not just rent.
Reasonable thinking. Wrong conclusion. And it is one more investors make than you would expect.
What low renter proportion actually signals to a tenant
A suburb where very few people rent is a suburb where very few renters look. It does not appear in their search. It is not in conversations at the share house, the café, or the group chat. It is simply not on the radar.
When your investment property lists for rent in a suburb with 5–8% renters, you are waiting for a narrow pool of accidental tenants to find you. Accidental tenants are not in a hurry.
The mistake most investors make is conflating two separate things: suburb quality and rental demand. You can have a beautifully maintained, aspirational, high-owner-occupier suburb with genuinely poor rental demand. The data shows this repeatedly and without apology.
What the data shows
HtAG Analytics plotted renter proportion against vacancy rate across thousands of Australian suburbs, drawing on ABS 2021 Census of Population and Housing data for renter proportion figures.
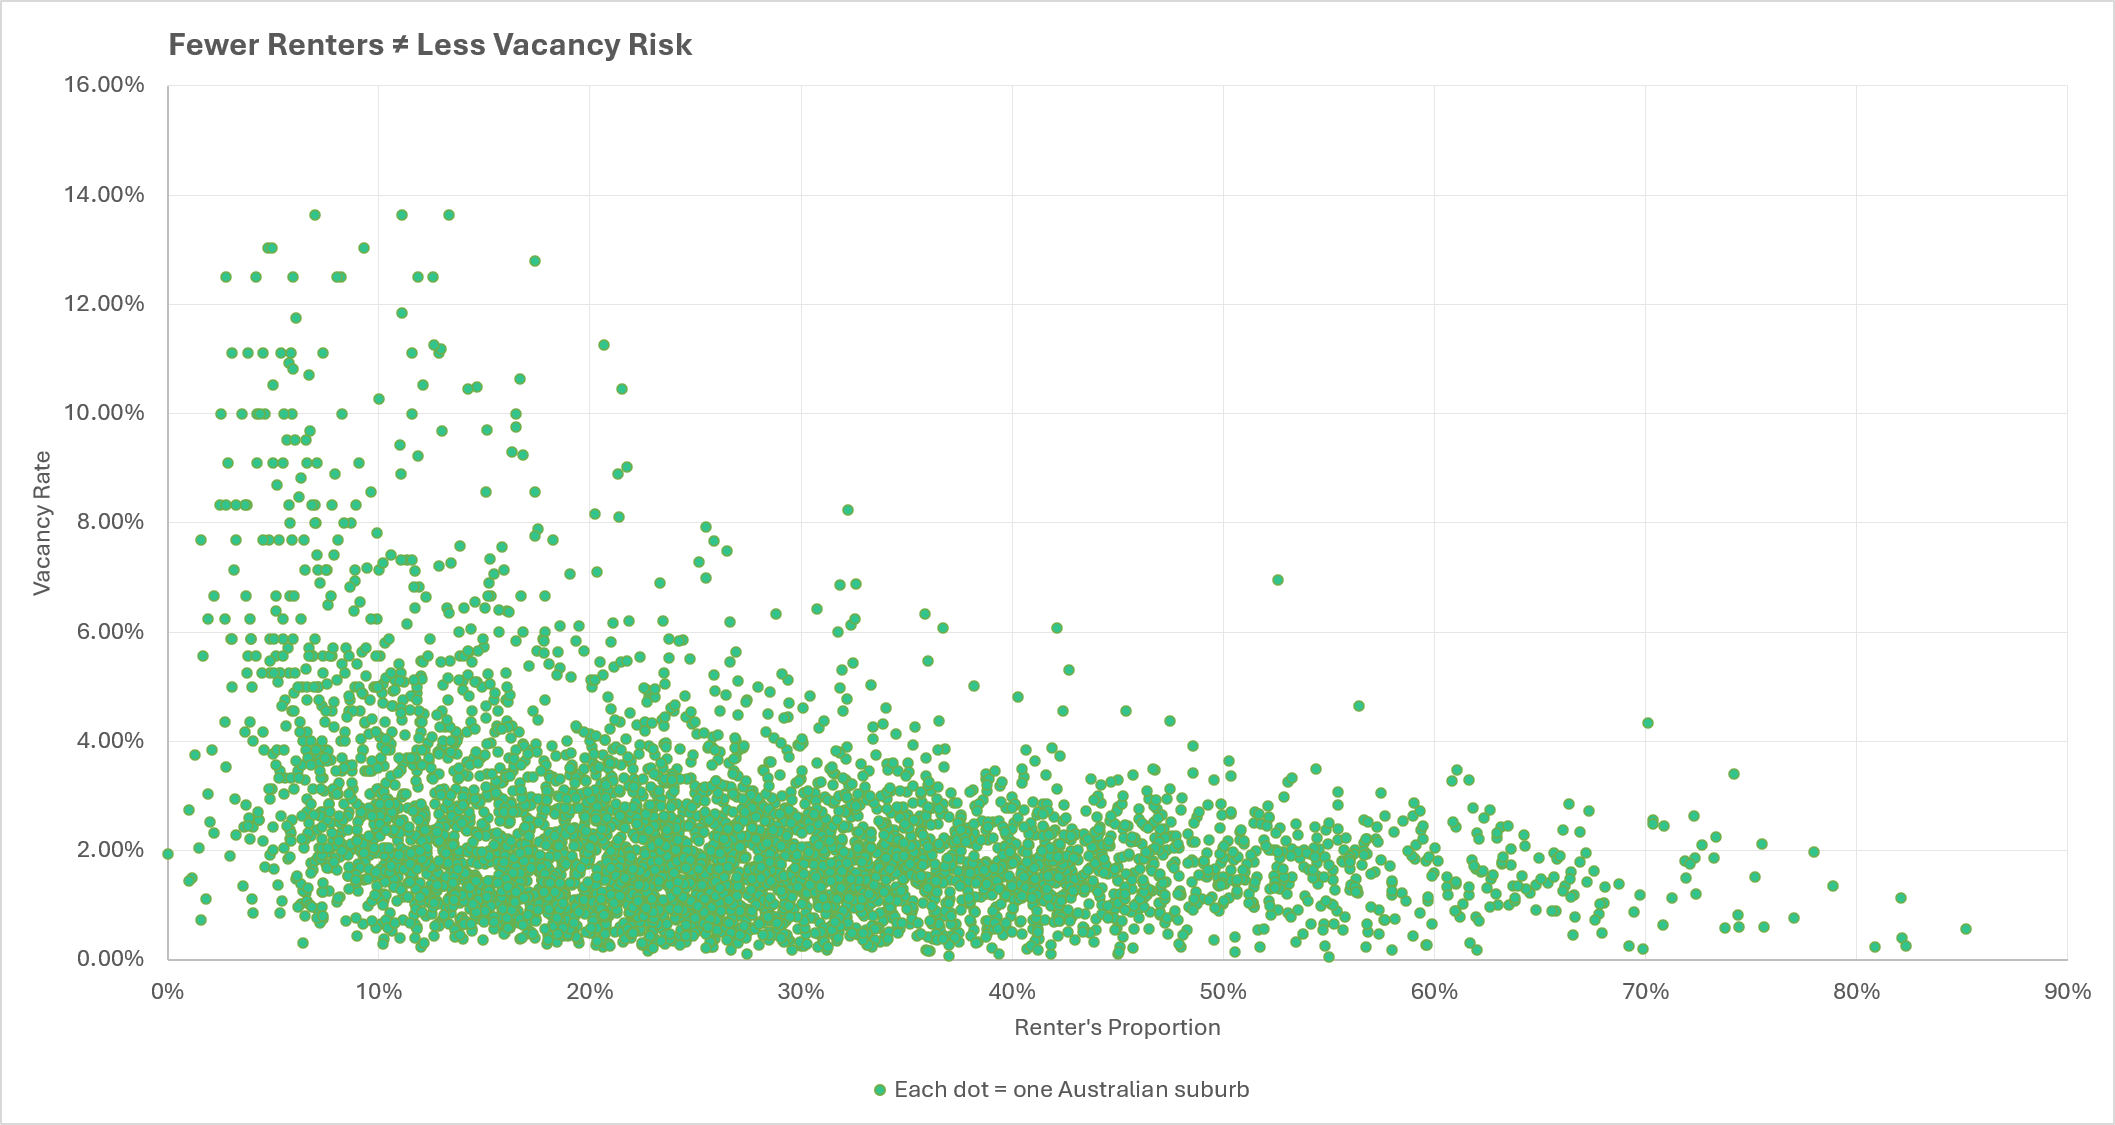
Caption: Source: HtAG Analytics; ABS 2021 Census of Population and Housing
The result is striking. Suburbs with the lowest renter proportions – under 10%, under 15% – scatter vacancy rates from near 0% all the way above 13%. No floor. No predictability. A suburb at 8% renters could sit at 0.5% vacancy or at 11%. The data gives you nothing to hold onto.
As renter proportion increases, the scatter compresses downward. Consistently. By 30–40% renters, the dots cluster well below 4%. By 40–50%, they press toward 2% and below.
The reason is structural. A suburb where renting is the norm has established, self-reinforcing demand. Renters have been looking there for years because that is how the suburb functions – workers, students, young families who need to rent in that location and have done so for decades. When your property comes to market, there is an existing pool of prospective tenants actively searching. Not silence.
The national vacancy rate sat at 1.2% in April 2026 – still less than half the floor of what a balanced market looks like. SQM Research, National Vacancy Rate bulletin, 12 May 2026. But that national figure papers over an enormous range of suburb-level outcomes. The difference between a suburb with structural rental demand and one without it can be the difference between 1% vacancy and 10%.
The other trap: when high renter proportion becomes a problem
Before anyone overcorrects – a suburb sitting well above its regional renter norm brings its own set of risks.
60% renters in a region averaging 25% is not the solution. In a soft rental period, you are competing against a larger number of landlords for the same tenant pool. Fewer owner-occupiers in the market means less price competition when you want to sell, which can constrain capital growth and make the resale case harder to argue. The structural quality that keeps vacancy low can create friction at exit that you did not see coming.
Both extremes work against you. Too low – renters do not look there and vacancy risk follows. Too high relative to the regional norm – landlord competition and a harder resale story follow. Different route, same destination.
Context is everything
The national renter proportion sits at approximately 31% – ABS 2021 Census of Population and Housing. That figure is nearly useless as a standalone benchmark at suburb level.
What matters is where a suburb sits relative to its own regional average.
A suburb at 35% renters inside a region averaging 40% is a very different proposition from the same 35% inside a region averaging 15%. In the first case, you are slightly below the regional norm – enough tenant demand to underpin low vacancy, enough owner-occupier presence to hold capital growth potential. In the second, you are well above the norm, with the risks that follow.
Most investors never run this comparison. They reach for the national figure, apply it universally, and discover the gap between expectation and reality when the property manager starts sending optimistic emails.
The right question before buying is not simply ‘what is the renter proportion?’ It is: where does this suburb sit relative to its regional average, and is that a position I understand?
Making it practical
Renter proportion is one layer in a broader due diligence process. Used alongside current vacancy rate data, days on market for rentals, and population and employment trend data, it becomes a genuinely useful screen.
Check renter proportion against the regional average – not the national figure
Cross-reference with current suburb-level vacancy rate data from SQM Research
Consider what is driving renter demand – employment, infrastructure, affordability – and whether those drivers are structural or cyclical
Think about direction: is the suburb becoming more or less renter-dominated over time?
Lowest is not safest. Highest is not boldest. Knowing where your suburb sits relative to its own regional average – and understanding what that means for vacancy risk, rental demand, and eventual resale – is the actual skill.
Most investors buy first and find out later. We do the analysis before you sign anything.