
Negative gearing and new builds: more loans, fewer homes
The short version
Investor loans to build new homes rose 20%, not 27%. The 27% figure is dollars, and the gap is build cost inflation
The uptrend started in September 2025, eight months before the budget
Australia finished 169,307 private homes last year, the fewest since 2014
In late August 2026, a Sydney builder with around 15,000 homes on its books ran out of money.
New South Wales finishes about 45,000 homes in a whole year. So one company was carrying a pipeline roughly the size of a third of a year's output for the entire state.
In the same week, the Prime Minister posted a video holding up an Australian Bureau of Statistics report, saying investor loans for new builds were up 27% and the housing changes were working. Those changes - negative gearing quarantined to established properties from July 2027 - were announced on budget night in May.
Both of those things happened. That is what makes this worth writing about.
A builder with 15,000 homes on its books ran out of money
Bathla Group entered voluntary administration on 25 August 2026, with Teneo appointed as administrators. Reported figures for its pipeline range from about 14,900 to considerably higher depending on the source, so treat 15,000 as an approximation rather than a precise count.
The detail that matters is not the company. It is the category. Construction remains the single largest source of company failures in Australia. ASIC recorded 3,472 construction businesses entering external administration in the 2025-26 financial year – more than any other industry.
Worth noting in the interests of accuracy: that figure was actually down 3.4% on the year before. Construction insolvencies are not at a record. They are simply, and persistently, the largest slice of a very large pie.
What the Prime Minister said, and what the data shows
The claim was that more investors are taking out loans to build new homes than ever before, with a 27% increase in loans for new builds.
The first part is true. Investor loans for the construction of new dwellings reached 8,468 in the June 2026 quarter, the highest in the ABS series, which begins in September 2019. Over the rolling year the figure was 31,837, also the highest on record.
The second part needs unpacking.
The 27% is dollars, not homes
There is no single 27% figure published in the headline ABS release. It sits in the detailed purpose data, and when you pull that data down, three separate cuts land near 27%.
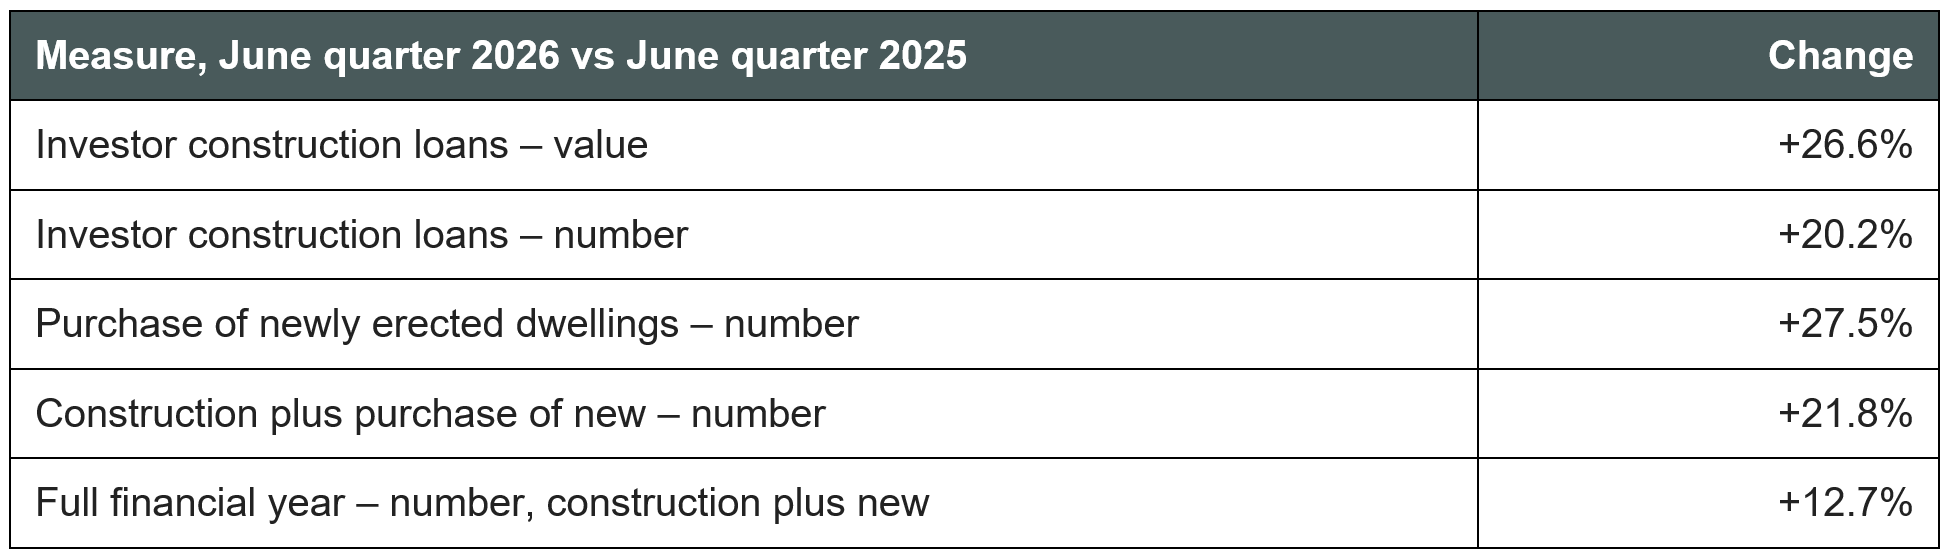
The series that actually corresponds to homes being built – the number of construction loans – rose 20.2%, not 27%.
The gap between 20% and 27% is not houses. It is price.
The average investor construction loan went from $668,977 to $704,207 over the year, up 5.3%. That tracks the cost of building. ABS producer price data shows house construction output prices rose 5.9% over the year and 2.0% in the June quarter alone. Building a house now costs 51% more than it did at the end of 2019.
So more dollars went into construction lending than last year. Somewhat fewer additional houses than the headline number implies.
The trend started before the budget
This is the part that most commentary on both sides has skipped, and it cuts against the political framing in both directions.
Investor construction loans have risen every single quarter since September 2025. The budget was handed down on 12 May 2026. That is eight months of an established uptrend before the policy existed.
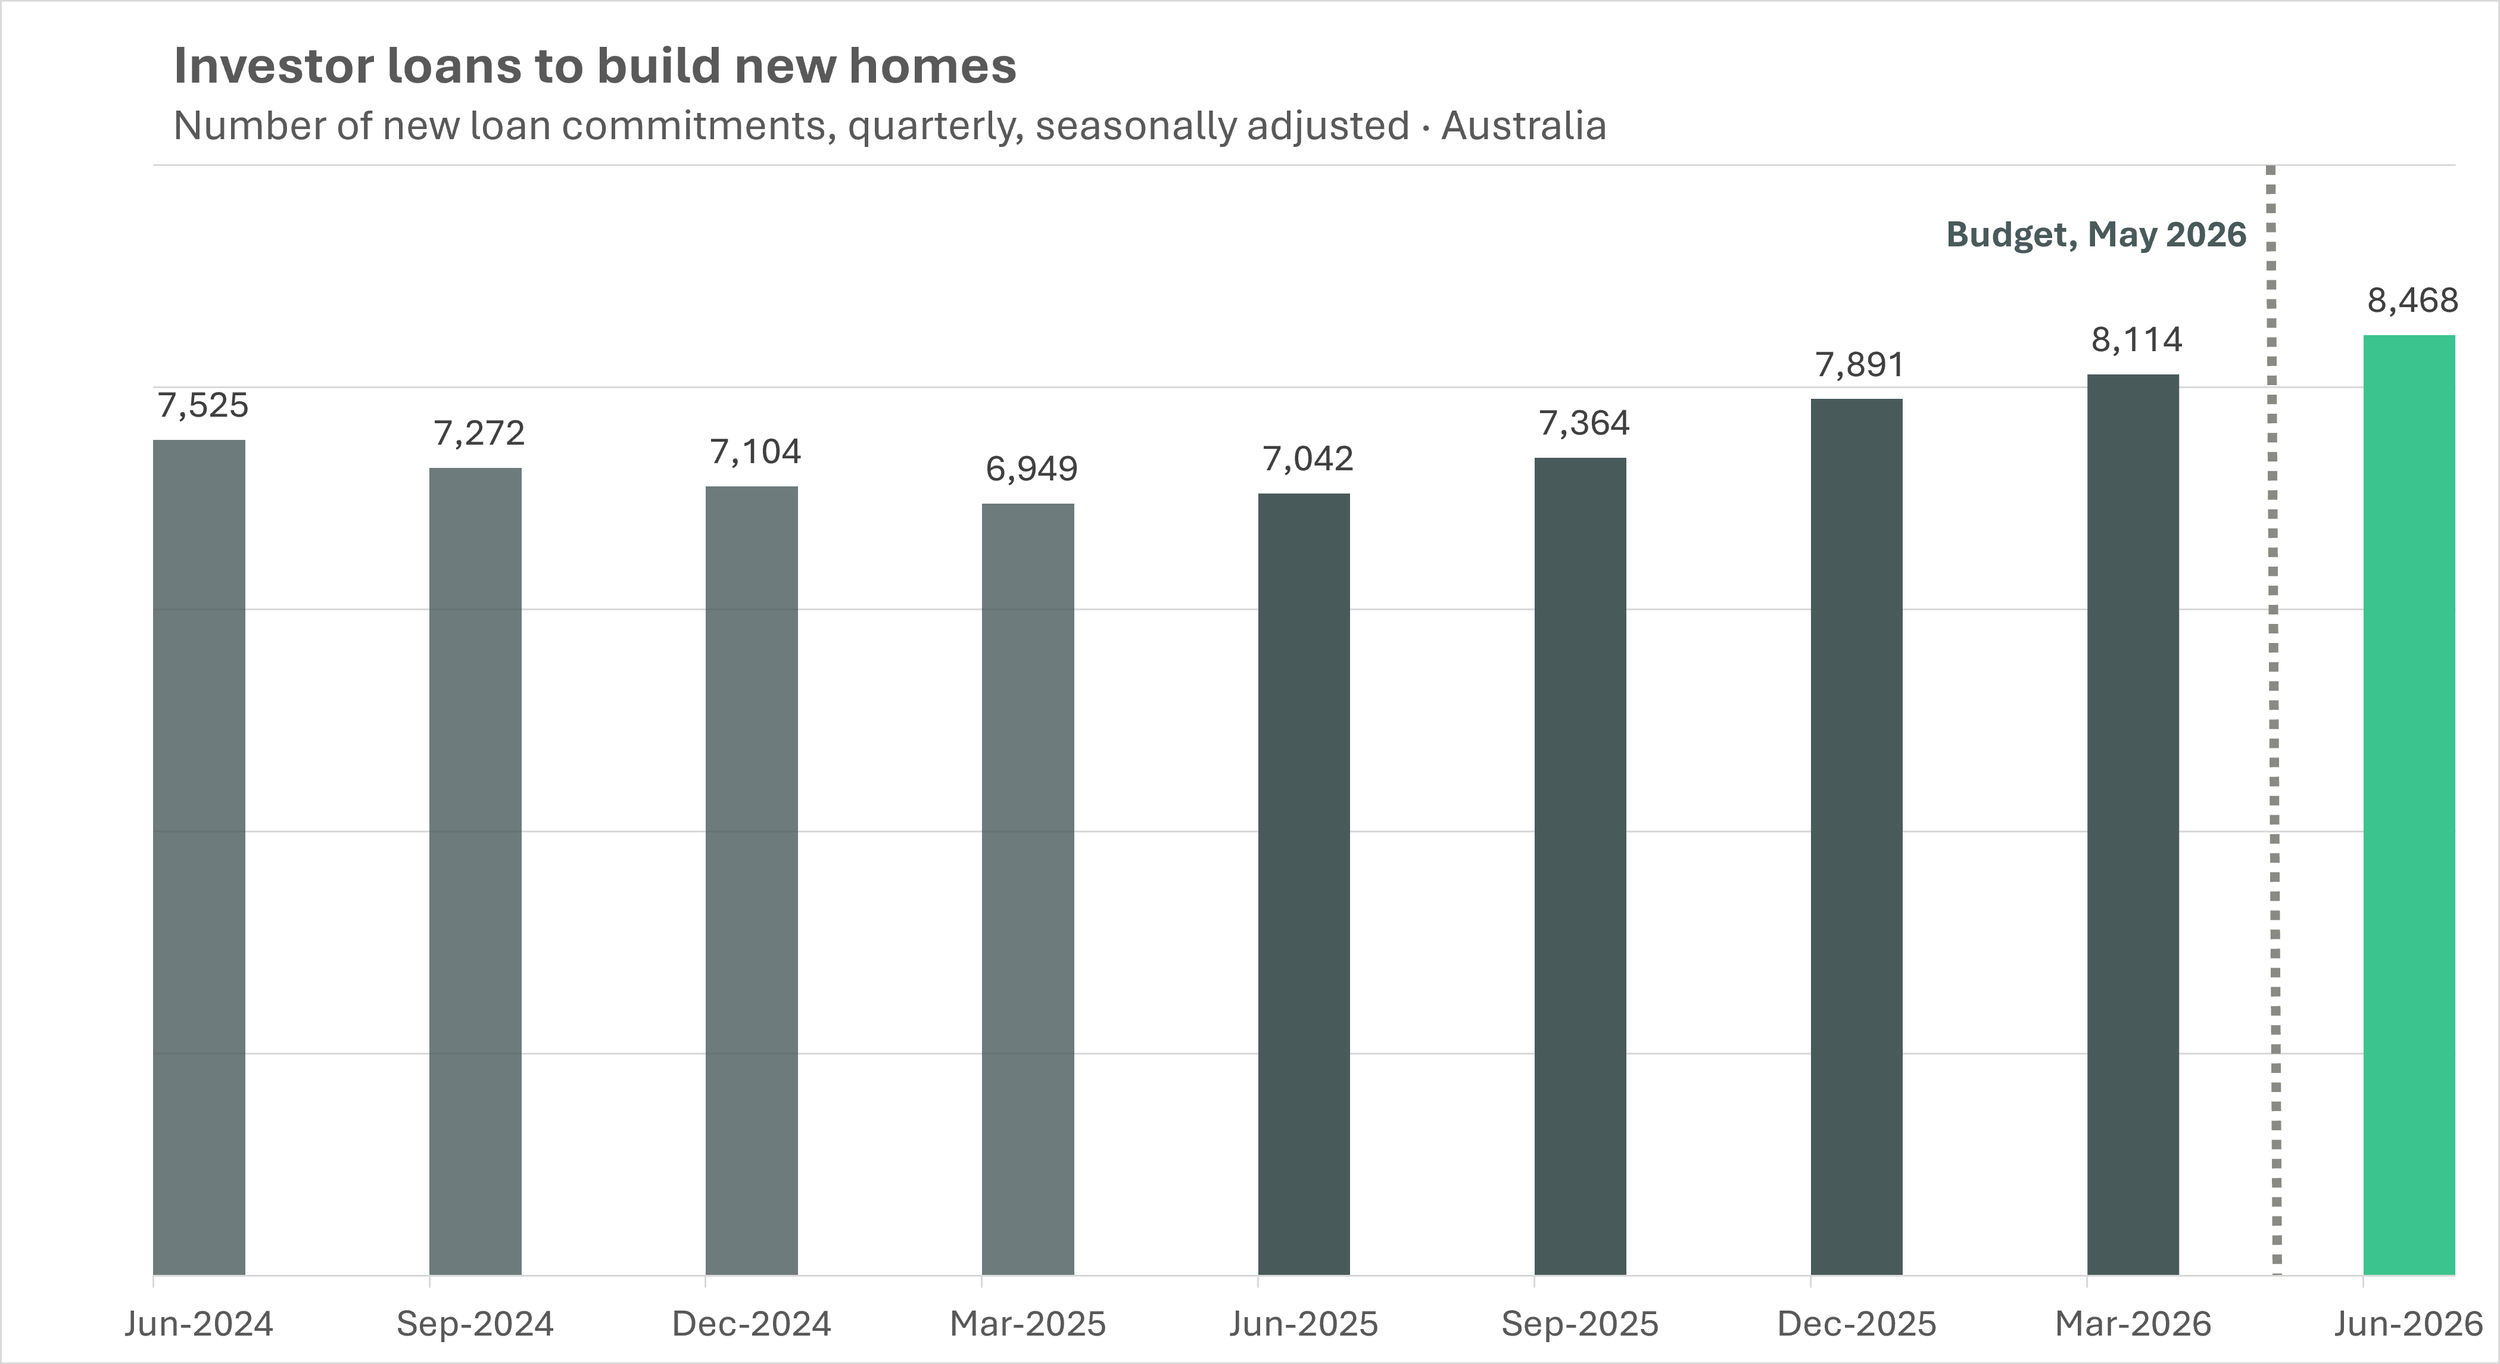
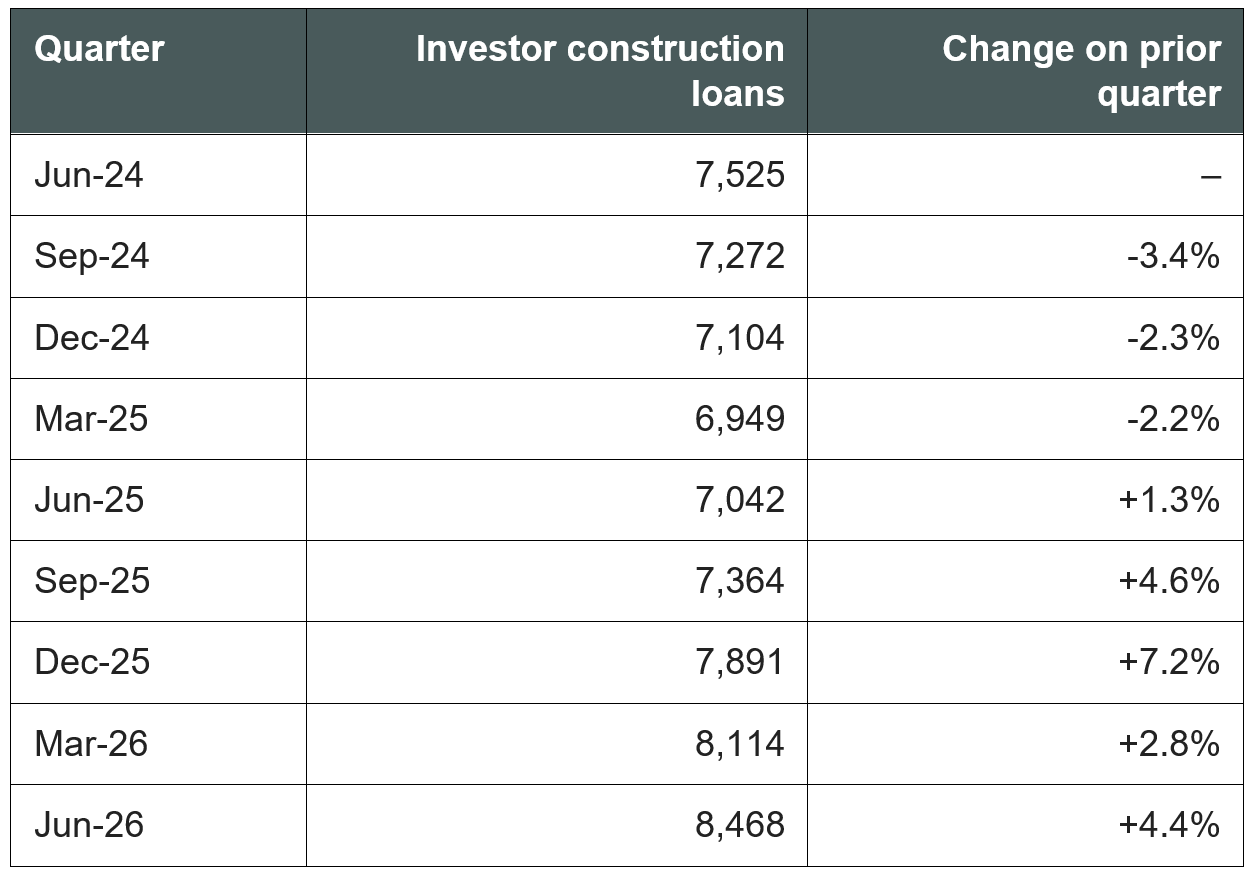
Look at the last two rows. The June 2026 quarter – the first one containing any post-budget activity – grew 4.4%. The December 2025 quarter, with no policy change at all, grew 7.2%.
It is far too early to credit the tax changes with a construction boom, and equally too early to dismiss them. What the data shows is a trend that was already running.
The first home buyer test
The stated purpose of the changes was to give first home buyers a fairer run by reducing investor competition for established homes.
The report being held up in that video contains the answer.
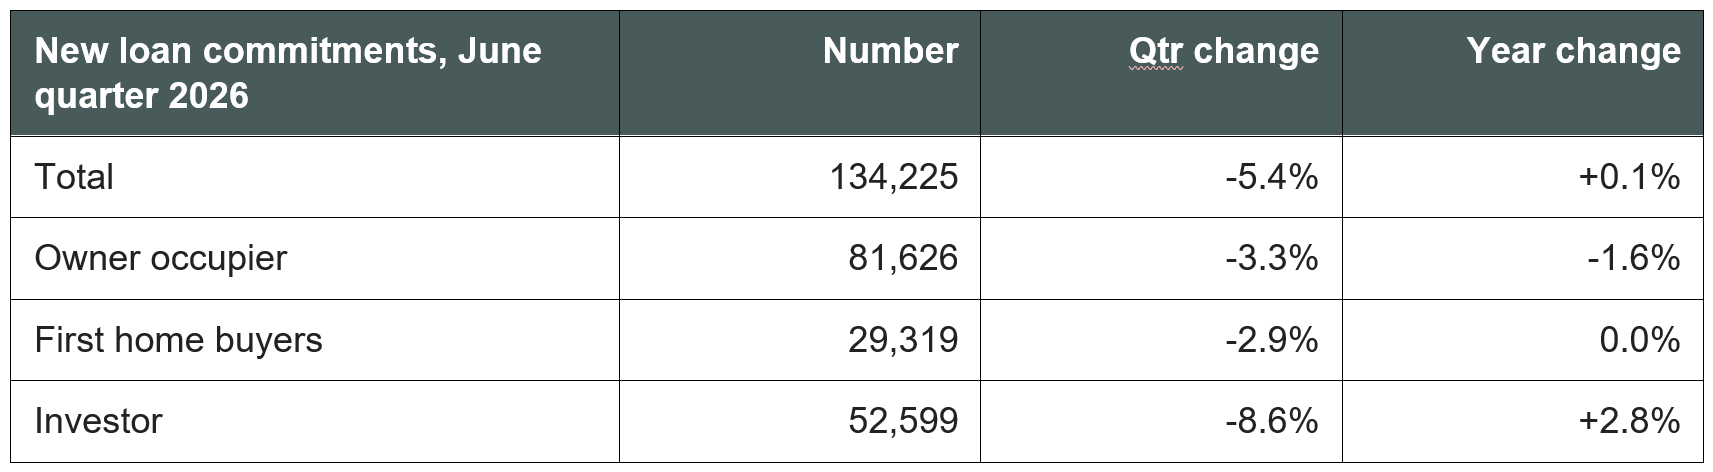
First home buyer loan commitments are down 2.9% for the quarter, and compared to a year earlier they moved 0.0%. Not up. Unchanged.
The investor competition part did happen. Investor loans for established dwellings fell 14.8% in a single quarter, which is the largest fall in the series and accounts for essentially the whole headline drop. Investors did step back from established property.
That has not, so far, produced a single additional first home buyer.
A loan is not a house
Here is the thing the loan data cannot tell you. A loan commitment is finance approved. It is not a slab, a frame, a roof or a set of keys.
Between the two sit a builder, a supply chain, a labour market and roughly two years.
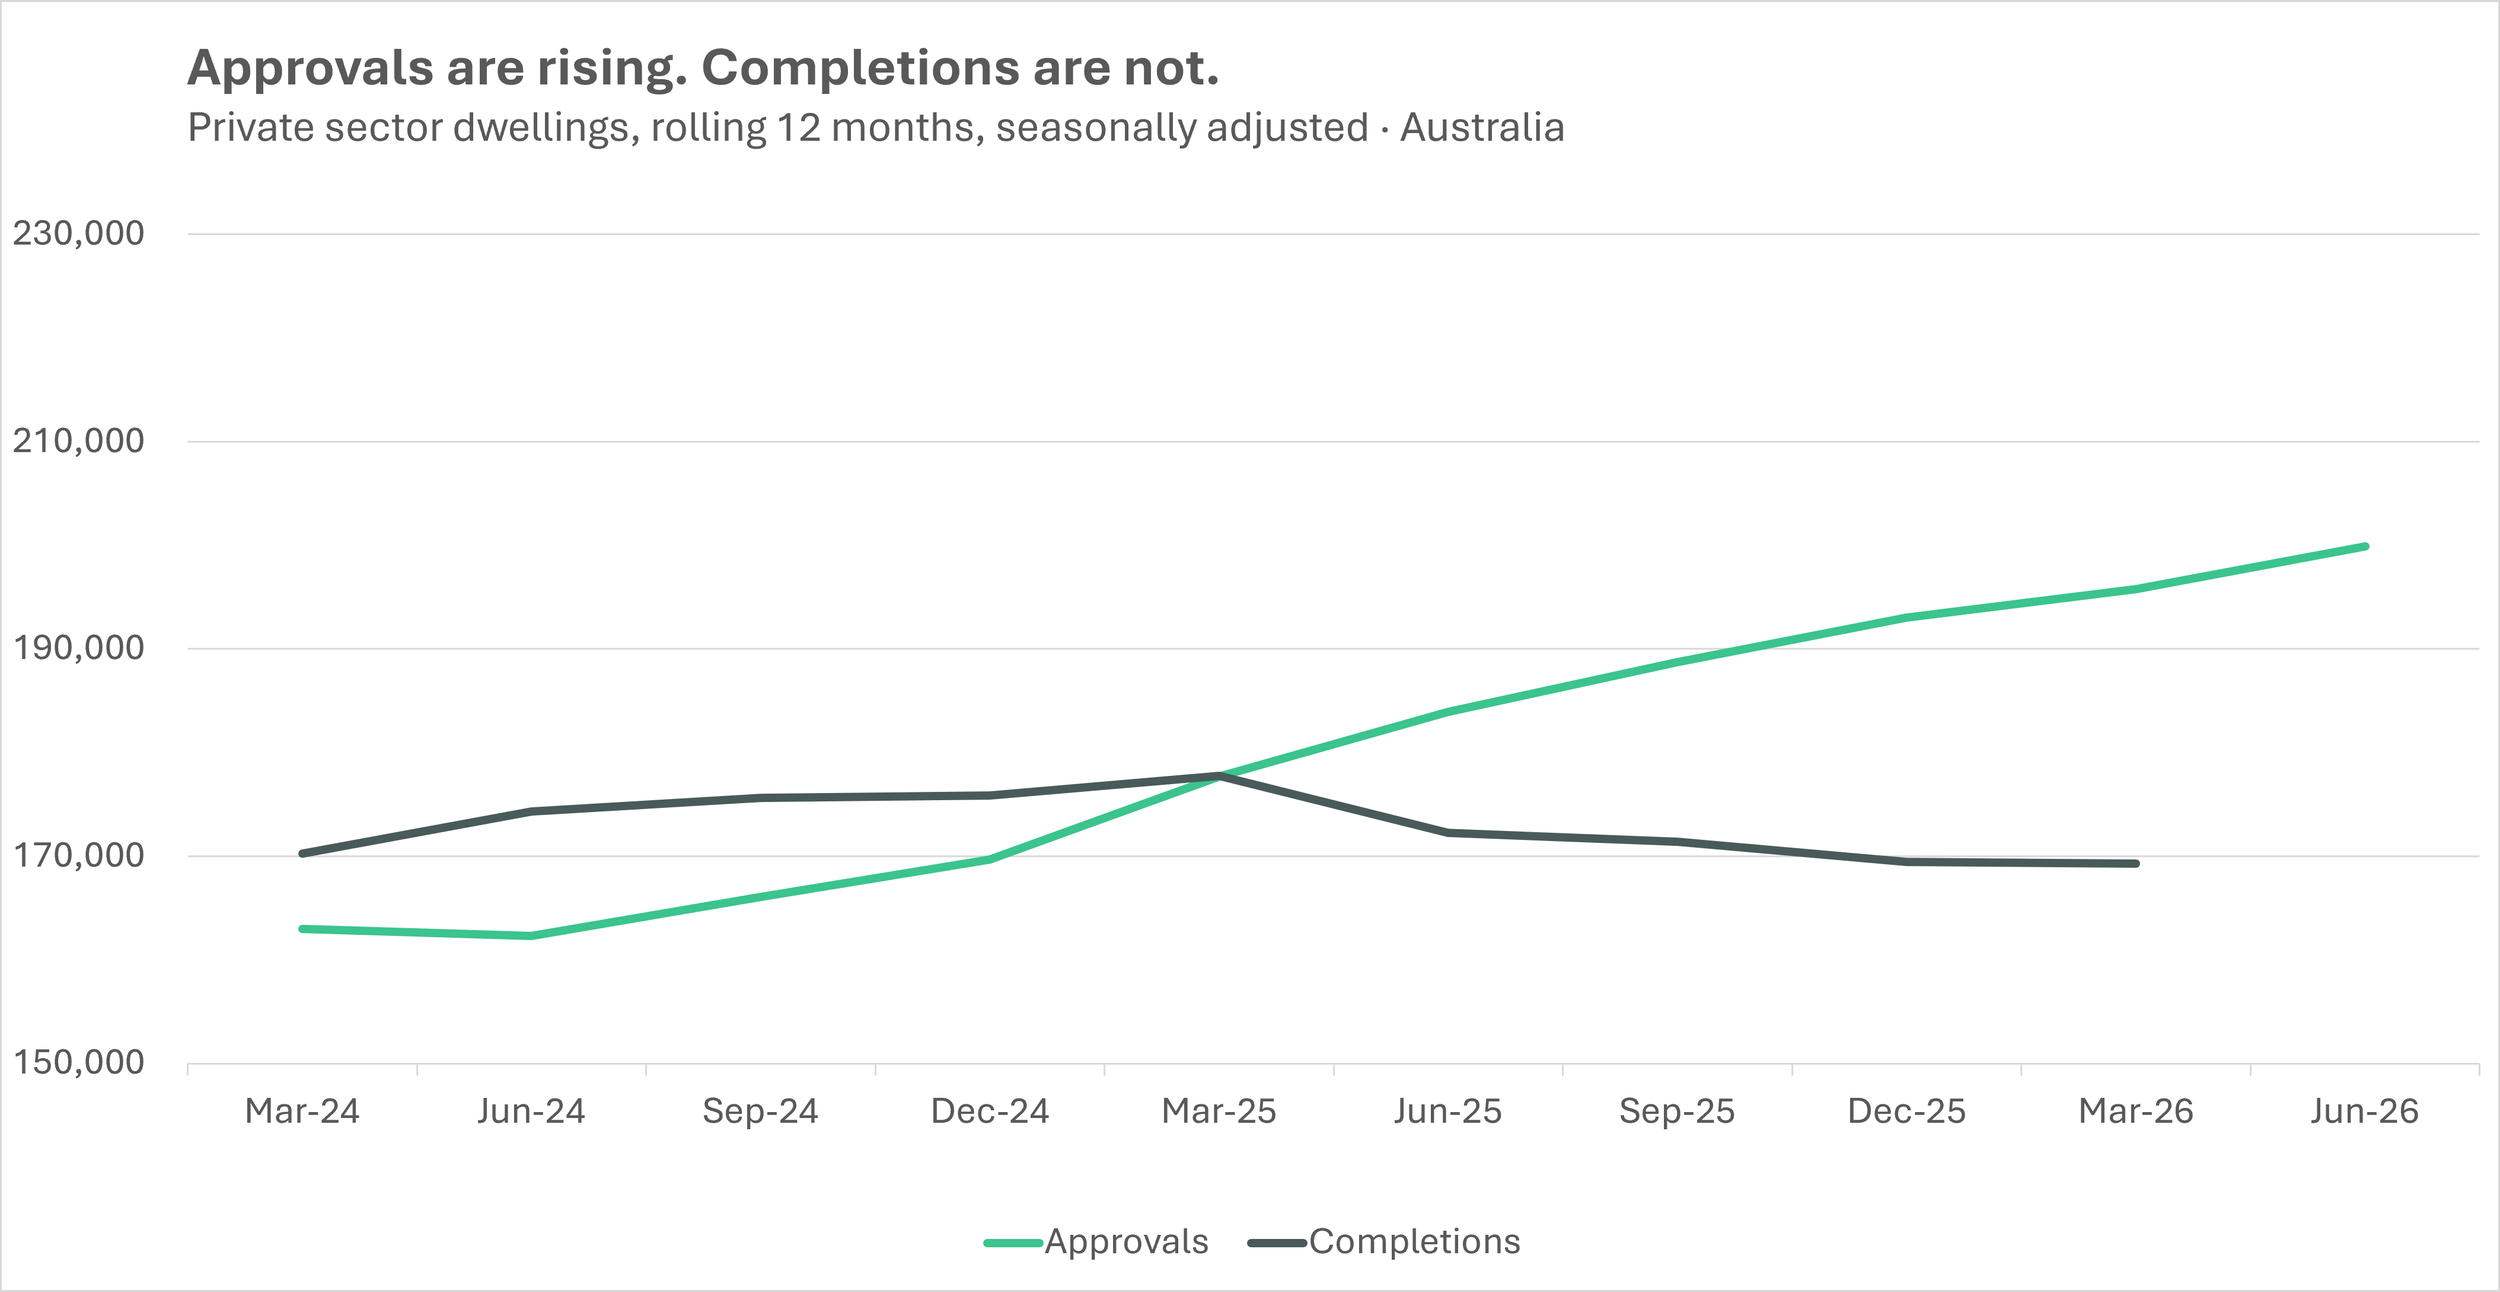
Australia finished 169,307 private dwellings in the twelve months to March 2026. That is the lowest figure since September 2014, and 23% below the March 2017 peak of 220,092. Private completions have now fallen for four consecutive quarters.
Detached houses have taken the worst of it. Private house completions came in at 107,278 for the year, the lowest since September 2021.
Why more money does not build more homes
There is a comfortable assumption running underneath a lot of housing policy: that if you direct more finance at new construction, more construction happens.
It does not work like that when the constraint is not money.
There were 243,864 dwellings under construction across Australia at March 2026. The pipeline is not short of projects. It is short of the trades, certifiers and site supervisors needed to finish them. When you push more demand into a sector that is already running at its physical limit, you do not get more output. You get the same output at a higher price.
Which is precisely what the 51% increase in build costs since 2019 is. It is the price signal of demand outrunning capacity.
You cannot fund your way past a shortage of builders.
The honest counter-argument
Three things push back against everything above, and it is worth putting them on the table rather than waiting for someone else to.
Timing. Loans written in 2026 become finished houses in 2028 or 2029. Completions today reflect approvals from 2023 and 2024. Comparing a leading indicator against a lagging one is not a like-for-like comparison, and anyone who says so has a point.
Replacement cost. Ray White's chief economist, Nerida Conisbee, has argued that build costs put a floor under established values, because established homes cannot sit far below the cost of new supply for long without projects stopping altogether. If that holds, rising build costs support prices rather than simply squeezing feasibility.
The share is not extreme. New builds now account for 20.8% of investor loans, up from 17.5% a year earlier. Real, but Westpac forecast that share moving toward 40 to 50%. It is running at roughly half the most bullish expectation.
The response to the timing argument is the one that matters. The question is not whether more loans eventually become more homes. It is what proportion of them survive the journey – and every measurable indicator of that survival rate is currently deteriorating. Commencements fell 11.2% in the March quarter. Costs are up 51%. Construction remains the biggest source of company failures in the country.
More is going into the pipe. Less is coming out the other end. Both of those are measured facts.
What this means if you are buying an investment property
The tax settings now favour new builds. That is a real and permanent feature of the landscape, and pretending otherwise would be silly.
But a deduction on a property that never gets finished is worth exactly nothing. Which means the builder has become part of the due diligence, in a way it simply was not five years ago.
Questions worth asking before you sign anything on a new build:
Who is the builder, and what does their financial position actually look like? Not their display suite. Their balance sheet.
How many projects have they delivered, and how many have they delivered late?
Who is funding the development, and what happens to that funding if presales slow?
What is the sunset date, and who benefits if the project runs past it?
What happens to your deposit if the builder enters administration? Where is it held, and who controls it?
What is the valuation risk at completion? You are locking a price today for a property that settles in two years, in a market where values fell 0.7% nationally in July 2026.
Is there a price escalation clause, and if so, what is your exposure if build costs rise again?
None of that is a tax question. It is a counterparty question. Most people buying in this market have never had to ask one.
Where this leaves you
Buy an established property badly and you have overpaid for an asset you own. Unpleasant, recoverable, and you can rent it out on Monday.
Buy a new build badly and the outcome is a different shape entirely. A deposit tied up for two years, a slab and a fence, and a completion valuation that disagrees with a price you agreed to in 2026.
Buy an existing house and you are buying a house. Buy a new build and you are buying a promise. A promise is only as good as the builder behind it.
The tax break is not the deal. Getting the keys is the deal.
If you're weighing a new build against an established property, that's the kind of question we work through with clients every week. Book a consultation and we'll talk through what the numbers look like for your situation.
General information only. Not financial advice.