
Rents will not rise 30% everywhere. Here is how to work out where they might.
Adelaide has one of the tightest rental markets in the country. Adelaide also recorded the slowest rent growth of any capital city over the past year.
Those two facts sit awkwardly together, and most of the commentary published since the Budget has quietly ignored the second one. It matters, because it is the clearest evidence available that a tight rental market does not automatically produce rising rents.
This article walks through what NAB actually published, why the 30% figure has been widely misread, and the one variable that decides how far rents can realistically move in any given market.
What NAB actually said
On 17 August 2026, NAB’s Head of Australian Economics, Gareth Spence, published a note to clients. The coverage that followed reduced it to a single number: rents up 30%.
That is not what the note says.
Spence wrote that the changes to investor tax settings mean gross rental yields will need to rise to compensate for the loss of tax benefits. In Sydney and Melbourne, that means moving from around 3.5% to around 4.5%.
A yield is rent divided by value. There are two ways to lift it. Rent goes up, or value comes down. The 25% to 30% figure is what you get if you hold value completely still and force rent to do all of the work.
Spence then said the part that almost nobody quoted – that the adjustment will likely require a combination of both higher rents and lower dwelling values.
So it was never a forecast. It was the upper bound of a two-variable equation with one variable artificially frozen.
For anyone buying, that combination is not bad news. A softer entry price sitting alongside a rising rent is a better acquisition setup than the reverse, and those conditions do not tend to last long.
The Adelaide paradox
Here is the SQM Research vacancy data for July 2026, released 14 August 2026.
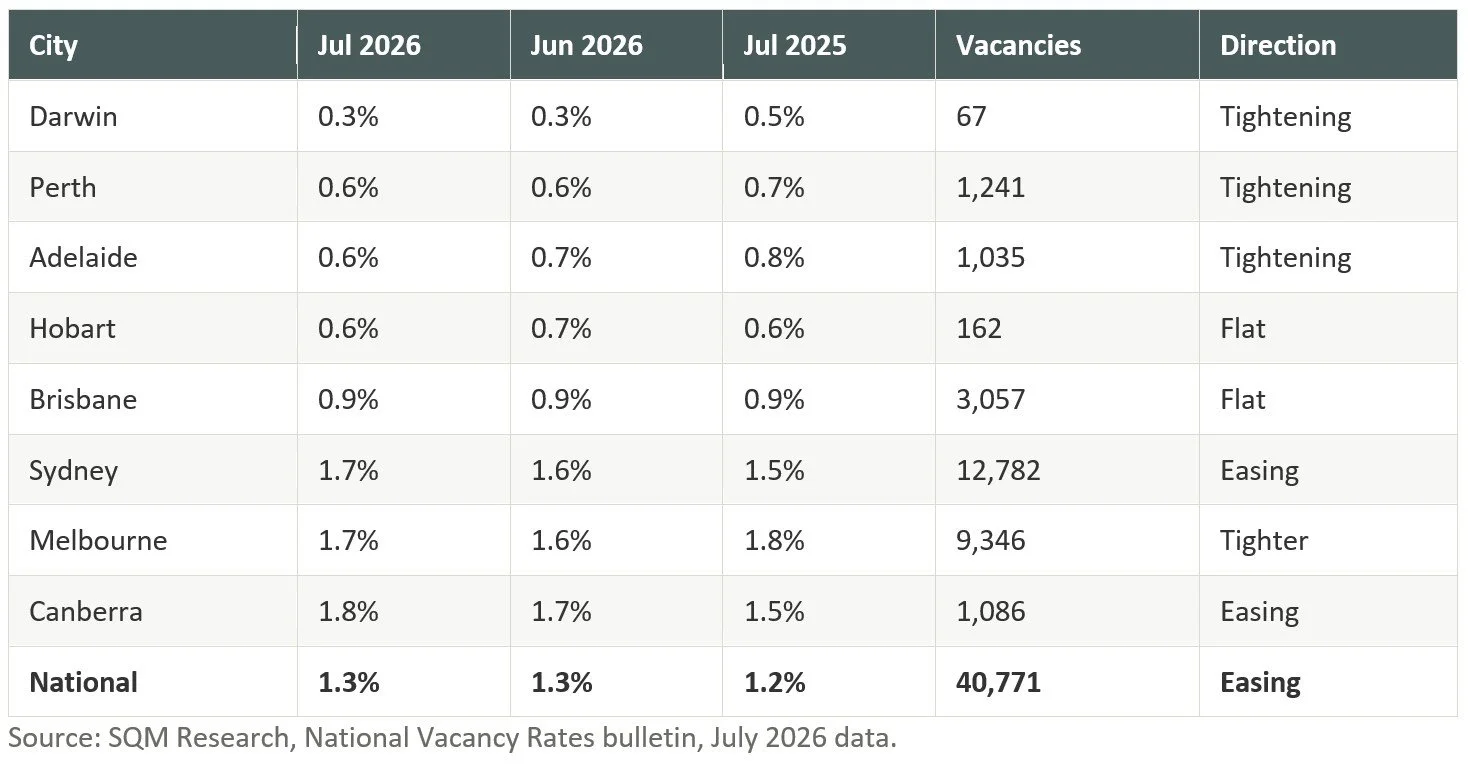
A balanced rental market is generally taken as 2.5% to 3.0% vacancy. Every capital city in Australia is below it. Five are below 1%.
Put Adelaide next to Sydney. In Adelaide, roughly 6 rentals in every 1,000 are sitting empty. In Sydney it is 17. Adelaide is close to 3 times harder to find a rental in.
Now look at what rents actually did over the year. Adelaide rose 3.5%. Sydney rose 6.3%.
If tightness alone drove rents, that result would be the wrong way around.
Vacancy tells you there is a queue. Income tells you who can pay
The missing variable is what tenants can afford, and Cotality publishes it.
In its Housing Affordability Report, Cotality tracks the share of median household income required to pay median rent in each capital. Adelaide sits at 35.5% – the highest of any capital city in Australia.
That did not happen by accident. Over the five years to September 2025, Adelaide rents rose 47.8%. Median household income over the same period rose 20.1%. Rent moved at roughly two and a half times the pace of the pay packet.
Adelaide tenants absorbed that. They are now absorbing about as much as they can. Which is why the tightest rental market in the country is producing the slowest rent growth in the country.
Cotality has said as much directly, noting that the moderation in rent growth is largely a function of affordability ceilings rather than any meaningful improvement in the supply and demand balance.
What a 30% rent rise would actually mean
It is worth running the numbers on the average wage rather than a hypothetical one, because the result is more uncomfortable that way.
The average full-time Australian wage is $2,083.70 a week before tax, or about $108,000 a year, according to ABS Average Weekly Earnings for May 2026. The average advertised rent nationally is $698.45 a week, per SQM Research.
That is 33.5% of gross income going on rent, before a single other bill is paid. It lines up almost exactly with Cotality’s national measure of 33.4%, which is a record high.
Now apply NAB’s 30%.
Rent moves from $698 a week to $908 a week.
That is an extra $209 every week, or roughly $10,900 a year.
Wages are growing at 3.2% a year, per the ABS Wage Price Index for the June quarter 2026. Over two years that delivers about $135 more a week.
So for every extra dollar landing in the pay packet, the rent is asking for a dollar fifty.
The end point is 40.9% of gross income going on rent. Before tax, before power, before groceries.
Households do not simply absorb that. They restructure. Two people take a house that one person was renting. Adult children move back home. Families share.
Each of those decisions removes a tenancy from the market. The affordability ceiling is not a soft limit – it enforces itself by destroying demand.
Where the ceiling actually binds
Combine the two datasets and the picture changes completely.
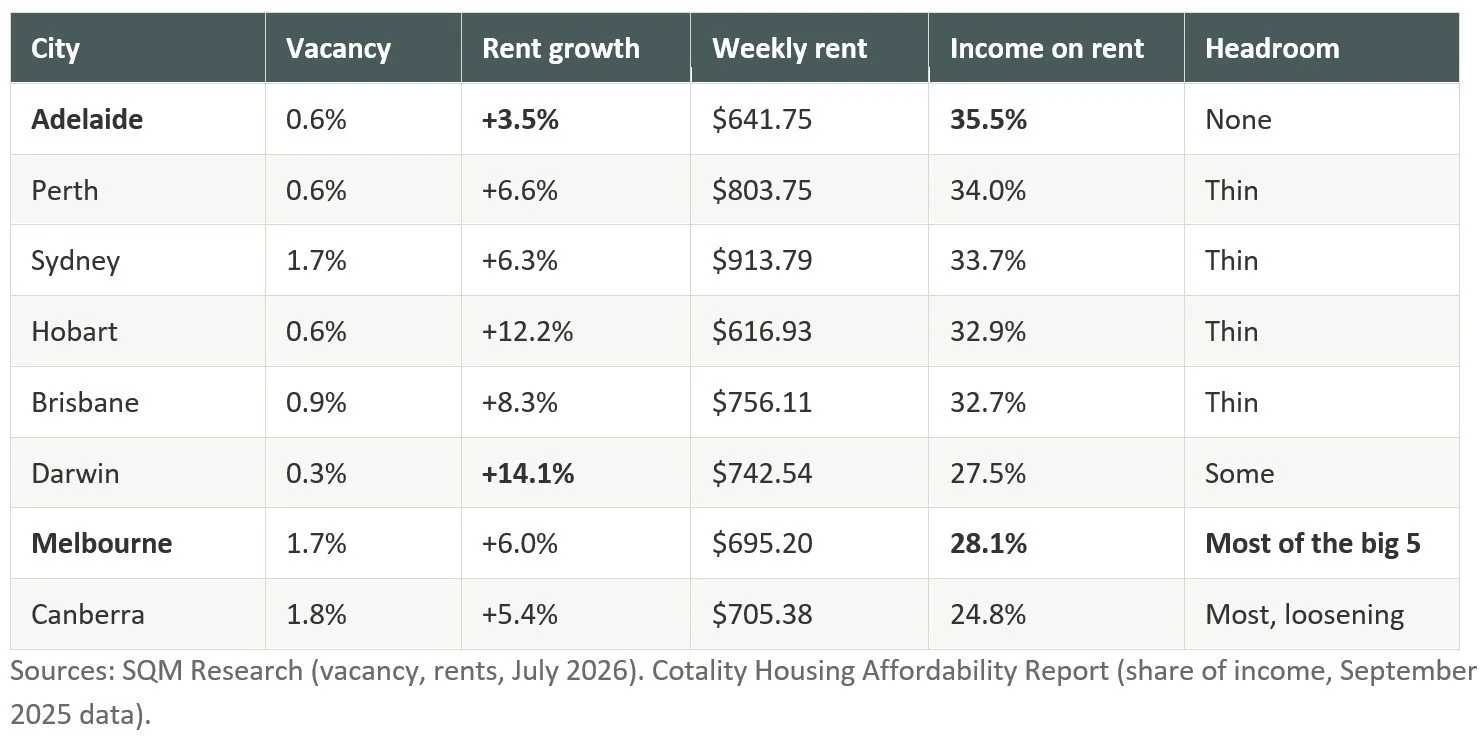
Read the Adelaide and Darwin rows together. Both are supply-constrained – 0.6% and 0.3% vacancy. Darwin produced 14.1% rent growth. Adelaide produced 3.5%.
The difference is not supply. Darwin tenants had around 8 cents in the dollar of headroom. Adelaide tenants had none.
That is the whole argument in two rows.
So what happens to rents from here
Rents keep rising. Investor demand for established stock has fallen sharply, and that flows through to rental supply with a lag.
ABS Lending Indicators for the June quarter 2026 recorded an 8.6% fall in the number of new investor loan commitments – the largest quarterly fall since September 2022 – with the value down 10.2%.
The pattern is likely to compound. 2027 should be a larger increase than 2026, and 2028 larger again, for as long as new rental supply lags household formation.
But that only continues in any given market until that market hits its own ceiling. And those ceilings are nowhere near each other.
Melbourne has the most room, and the biggest caveat
Melbourne renters spend 28.1% of household income on rent – the lowest of the big five capitals and about 7 percentage points below Adelaide.
At the same time, Melbourne’s vacancy rate has tightened over the year, from 1.8% to 1.7%. Melbourne’s advertised rent of $695 a week now sits below Brisbane, Perth, Darwin, Canberra and Sydney – in Australia’s second-largest city.
Tight and getting tighter, with meaningful income headroom left. On the framework above, that is where a large rent number is actually possible.
The counter-argument deserves airtime. Victoria carries roughly 30% of the national dwelling construction pipeline. Supply is the one thing that reliably caps rent growth, and Victoria has more of it coming than anywhere else. Victoria’s investor tax settings are also part of why Melbourne rents stayed low in the first place, and those settings have not changed.
Headroom is a necessary condition, not a sufficient one. It tells you a market has not yet hit its ceiling. It does not tell you the market will run to it.
Investors have not left. They have rotated
One correction worth making, because it undercuts the simpler version of the rental supply story.
Within that June quarter drop, loans to investors buying established dwellings fell 14.8%. Loans to investors buying new builds rose 4.4%, to a record high.
Investors have not exited residential property. They have moved to where the tax treatment still works, which is new construction.
The problem is not that rental stock disappears entirely. It is that the new rental stock is being created in outer-ring greenfield estates and apartment towers, while tenant demand is concentrated in established middle-ring suburbs near work, transport and schools. Supply arriving in the wrong postcode does very little for rents in the right one.
What this means if you are buying
The practical takeaway is a change in how you screen a market.
A low vacancy rate on its own is not an investment case. It tells you there is a queue. It does not tell you whether the person at the front of that queue has anything left to give.
Check the vacancy rate, then check what tenants in that market already spend on rent as a share of income.
A market at 0.5% vacancy where tenants already commit 38% of income has very little room left, regardless of how the supply figures look.
A market at 1.5% vacancy where tenants commit 26% has room, provided the supply pipeline does not swamp it.
Run the same test at suburb level, not just city level. Capital city averages hide enormous variation, and the ceiling binds locally.
Stress-test your holding costs against slower rent growth than the headlines imply, not faster.
Buying the first condition without the second is not a yield play. It is a ceiling.